Visualizing audio#
import os
from splaat.audio.load import load_audio
from splaat.plot.spectrogram import plot_spectrogram
audio_directory = os.path.join(os.path.dirname(os.path.abspath("")), "_static", "audio")
audio, sr = load_audio(os.path.join(audio_directory, "mfa.wav"))
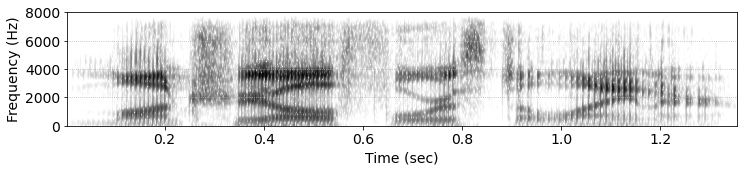
ret = plot_spectrogram(audio, sr, channel=0)
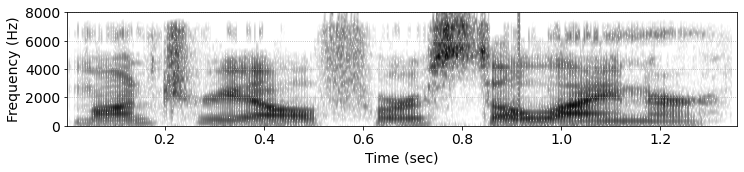
ret = plot_spectrogram(audio, sr, channel=1)
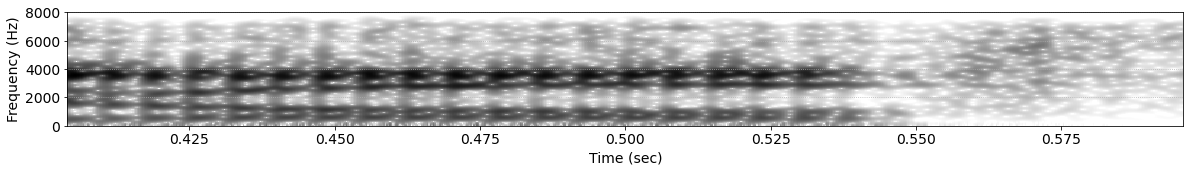
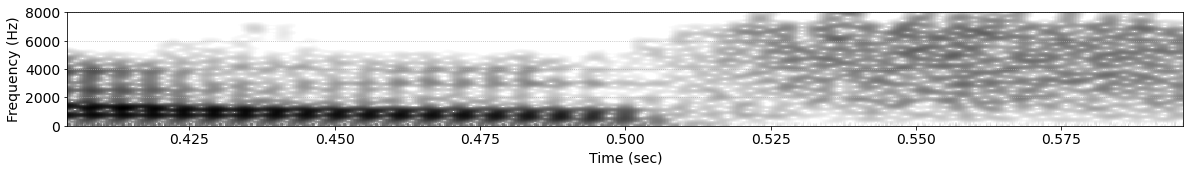
ret = plot_spectrogram(audio, sr, channel=0, start=0.4, end=0.6, figure_width=20)
ret = plot_spectrogram(audio, sr, channel=1, start=0.4, end=0.6, figure_width=20)
import os
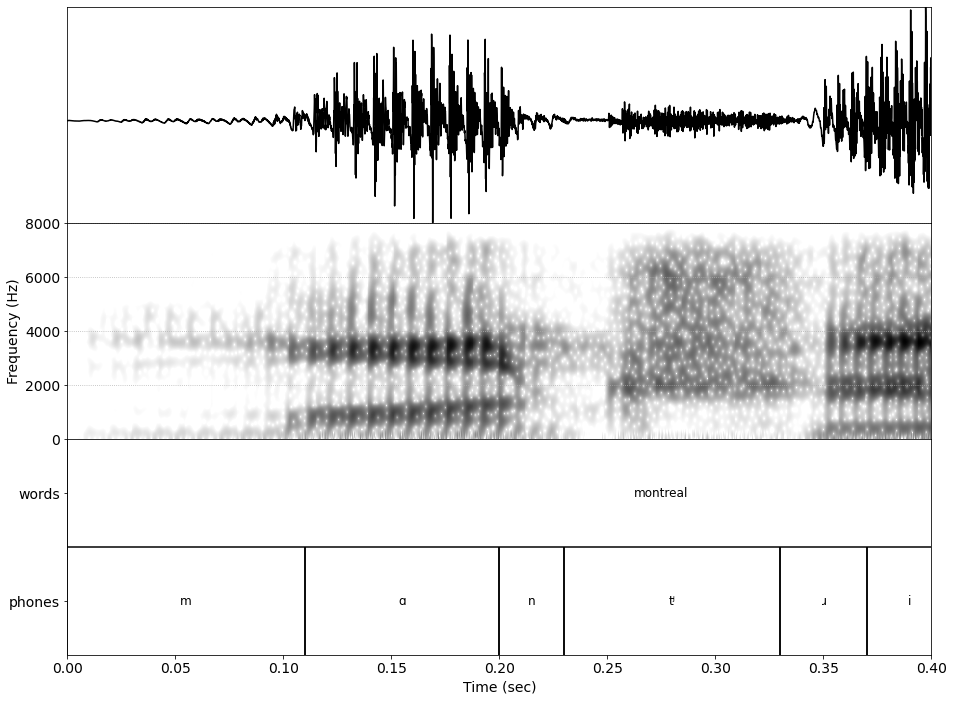
from splaat.plot.combined import plot_file
audio_path = os.path.join(os.path.dirname(os.path.abspath("")), "_static", "audio", "mfa.wav")
tg_path = os.path.join(os.path.dirname(os.path.abspath("")), "_static", "textgrids", "mfa.TextGrid")
fig = plot_file(audio_path, tg_path, start=0, end=0.4)